



H-R Diagram Inquiry Lab | Star Classification & Fusion
$8.00Price
No Reviews YetShare your thoughts.
Be the first to leave a review.
Students can label the regions of an H-R diagram and still have no idea why the stars fall where they do. A beautifully labeled chart isn't the same thing as an explanation. So this H-R diagram inquiry lab begins with a different question: Do stars that look alike actually work alike?
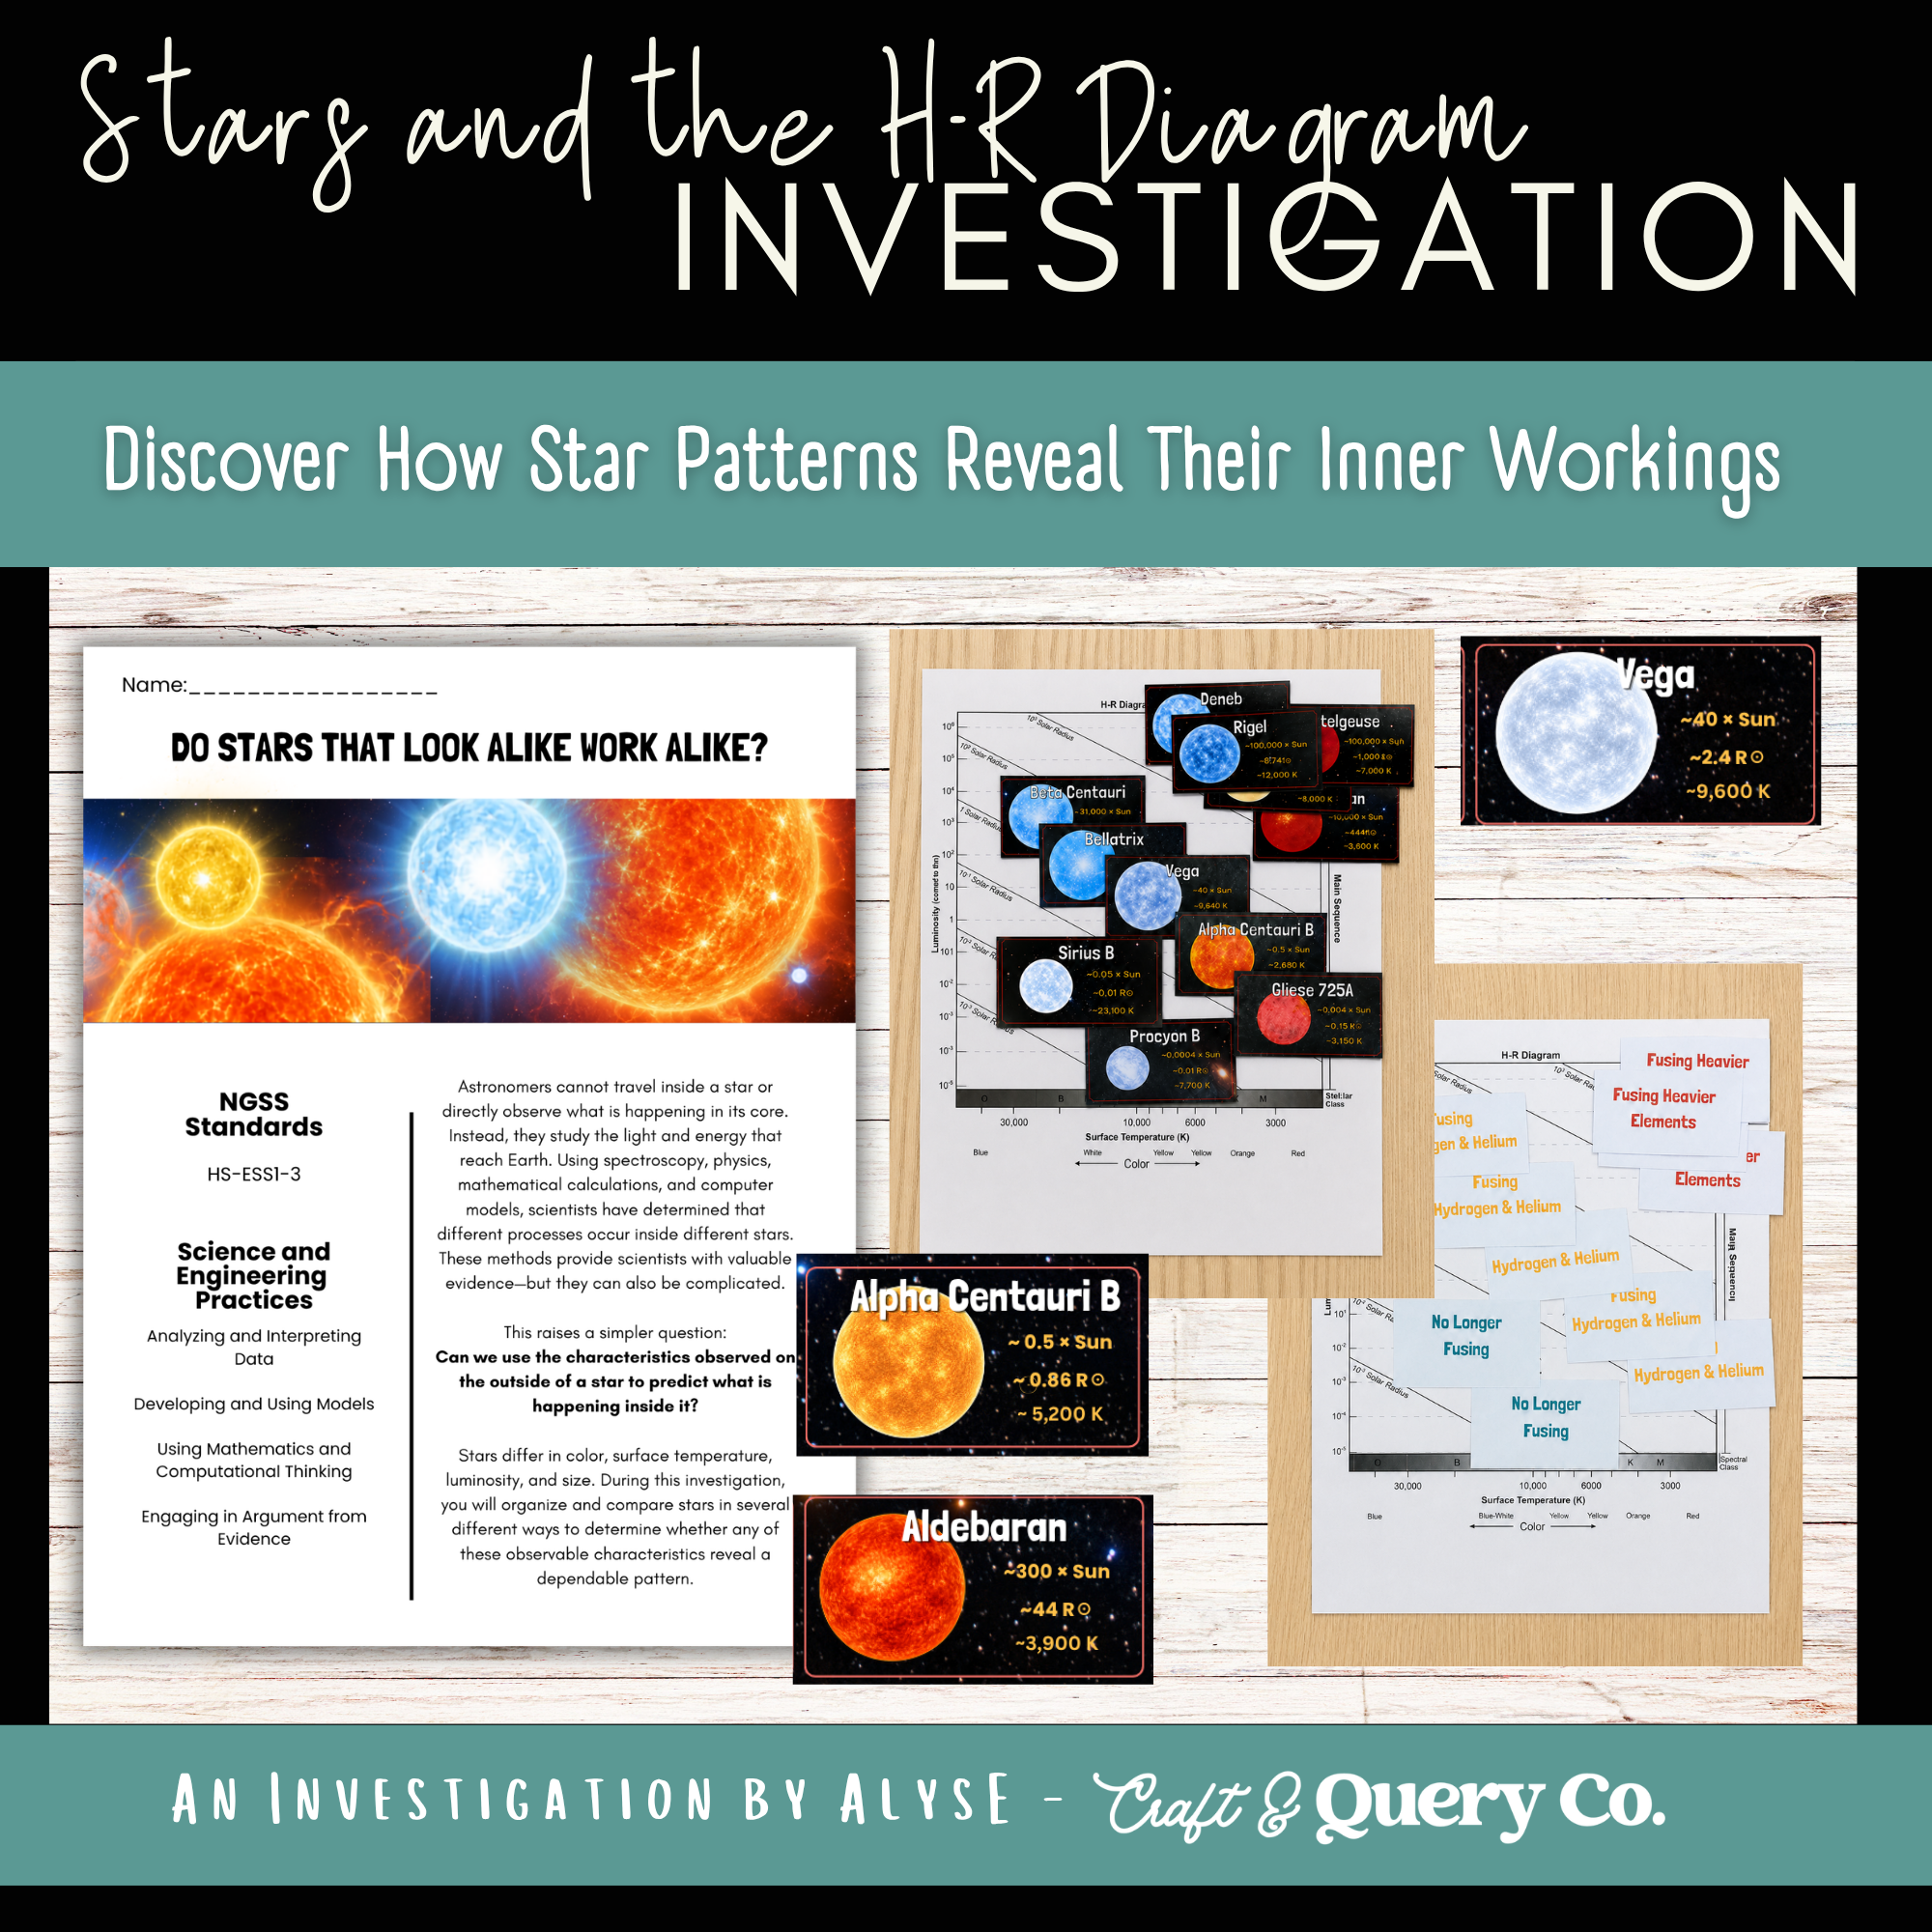
Students start with cards showing star color, surface temperature, luminosity, and radius. They sort stars by patterns they notice, then test whether those patterns tell them what's happening inside each star. Some groups look convincing—right up until an inconvenient star refuses to fit. Next, they group stars by internal processes and ask whether stars that work alike also look alike. The mismatch gives students a genuine reason to look for a better model.
Only then do students organize the stars on an H-R diagram using temperature and luminosity. Main-sequence stars, giants and supergiants, and white dwarfs begin to form recognizable regions. Instead of memorizing a chart someone else filled in, students use it to make sense of the patterns they've uncovered.
Examine star cards and create their own classification rules using observable characteristics.
Test whether stars grouped by appearance share the same internal processes.
Re-sort stars by what is happening inside them and look for evidence that challenges an initial pattern.
Organize stars by surface temperature and luminosity on a large H-R diagram mat.
Build and refine a model of the H-R diagram's regions, then compare it with a labeled scientific reference.
Use the diagram to make inferences about unfamiliar stars and answer application questions.
I don't want students to finish an H–R diagram with every region labeled and still have no idea what the diagram explains. That's why I designed the first star sort to be plausible—but not quite sufficient. Students use observable characteristics to build a rule, then encounter stars that force them to question it.
The second sort asks what is happening inside the stars. That shift from appearance to internal process creates a real need for temperature and luminosity as a better way to organize evidence. Students construct the H–R model after they have a reason to use it, then answer application questions that reveal whether they understand the patterns or only remember where the labels go.
Printable student investigation packet
12 double-sided star-sorting cards
Large blank H-R diagram card-sorting mat
Student H-R diagram modeling page
Labeled H-R diagram reference
Scientific conclusion and confirmation page
Multiple-choice assessment questions and short-answer application questions
Complete answer key
Teacher directions for preparation and classroom use
Designed for high-school and advanced middle-school Earth Science and astronomy, including star classification and stellar fusion topics. The activity is a printable card-sort and model-building investigation. Prepare the cards and sorting mat before the lesson. A companion H-R graphing practice activity is available separately for students who need more support with temperature, luminosity, and radius scales.